Cracking the mystery of the corrosive ocean

Around 55 million years ago, an abrupt global warming event triggered a highly corrosive deep-water current to flow through the North Atlantic Ocean. This process, suggested by new climate model simulations, resolves a long-standing mystery regarding ocean acidification in the deep past.

The rise of CO2 that led to this dramatic acidification occurred during the Paleocene-Eocene Thermal Maximum (PETM), a period when global temperatures rose by around 5°C over several thousand years and one of the largest-ever mass extinctions in the deep ocean occurred.

The PETM, 55 million years ago, is the most recent analogue to present-day climate change that researchers can find. Similarly to the warming we are experiencing today, the PETM warming was a result of increases in atmospheric CO2. The source of this CO2 is unclear, but the most likely explanations include methane released from the seafloor and/or burning peat.

During the PETM, like today, emissions of CO2 were partially absorbed by the ocean. By studying sediment records of the resulting ocean acidification, researchers can estimate the amount of CO2 responsible for warming. However, one of the great mysteries of the PETM has been why ocean acidification was not evenly spread throughout the world’s oceans but was so much worse in the Atlantic than anywhere else.

This pattern has also made it difficult for researchers to assess exactly how much CO2 was added to the atmosphere, causing the 5°C rise in temperatures. This is important for climate researchers as the size of the PETM carbon release goes to the heart of the question of how sensitive global temperatures are to greenhouse gas emissions.

Solving the mystery of these remarkably different patterns of sediment dissolution in different oceans is a vital key to understanding the rapid warming of this period and what it means for our current climate.

A study recently published in Nature Geoscience shows that my co-authors Katrin Meissner, Tim Bralower and I may have cracked this long-standing mystery and revealed the mechanism that led to this uneven ocean acidification.

We now suspect that atmospheric CO2 was not the only contributing factor to the remarkably corrosive Atlantic Ocean during the PETM. Using global climate model simulations that replicated the ocean basins and landmasses of this period, it appears that changes in ocean circulation due to warming played a key role.

55 million years ago, the ocean floor looked quite different than it does today. In particular, there was a ridge on the seafloor between the North and South Atlantic, near the equator. This ridge completely isolated the deep North Atlantic from other oceans, like a giant bathtub on the ocean floor.

In our simulations this “bathtub” was filled with corrosive water, which could easily dissolve calcium carbonate. This corrosive water originated in the Arctic Ocean and sank to the bottom of the Atlantic after mixing with dense salty water from the Tethys Ocean (the precursor to today’s Mediterranean, Black, and Caspian Seas).

Our simulations then reproduced the effects of the PETM as the surface of the Earth warmed in response to increases in CO2. The deep ocean, including the corrosive bottom water, gradually warmed in response. As it warmed it became less dense. Eventually the surface water became denser than the warming deep water and started to sink, causing the corrosive deep water mass to spill over the ridge – overflowing the “giant bath tub”.

The corrosive water then spread southward through the Atlantic, eastward through the Southern Ocean, and into the Pacific, dissolving sediments as it went. It became more diluted as it travelled and so the most severe effects were felt in the South Atlantic. This pattern agrees with sediment records, which show close to 100% dissolution of calcium carbonate in the South Atlantic.

If the acidification event occurred in this manner it has important implications for how strongly the Earth might warm in response to increases in atmospheric CO2.

If the high amount of acidification seen in the Atlantic Ocean had been caused by atmospheric CO2 alone, that would suggest a huge amount of CO2 had to go into the atmosphere to cause 5°C warming. If this were the case, it would mean our climate was not very sensitive to CO2.

But our findings suggest other factors made the Atlantic far more corrosive than the rest of the world’s oceans. This means that sediments in the Atlantic Ocean are not representative of worldwide CO2 concentrations during the PETM.

Comparing computer simulations with reconstructed ocean warming and sediment dissolution during the event, we could narrow our estimate of CO2 release during the event to 7,000 – 10,000 GtC. This is probably similar to the CO2 increase that will occur in the next few centuries if we burn most of the fossil fuels in the ground.

To give this some context, today we are emitting CO2 into the atmosphere at least 10 times faster than than the natural CO2 emissions that caused the PETM. Should we continue to burn fossil fuels at the current rate, we are likely to see the same temperature increase in the space of a few hundred years that took a few thousand years 55 million years ago.

This is an order of magnitude faster and it is likely the impacts from such a dramatic change will be considerably stronger.

Written with the help of my co-authors Katrin and Tim, as well as our lab’s communications manager Alvin Stone.

The Most Terrifying Papers I Read Last Year

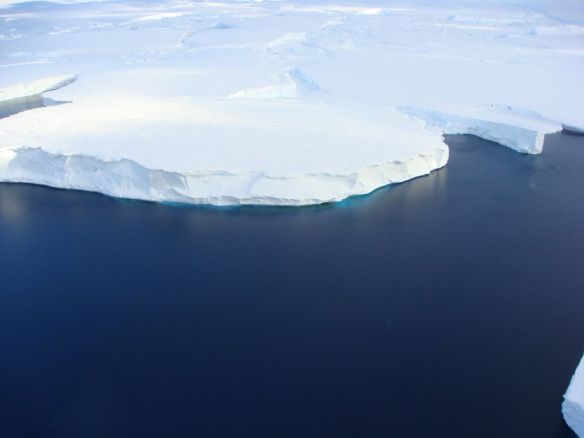
An ice sheet forms when snow falls on land, compacts into ice, and forms a system of interconnected glaciers which gradually flow downhill like play-dough. In Antarctica, it is so cold that the ice flows right into the ocean before it melts, sometimes hundreds of kilometres from the coast. These giant slabs of ice, floating on the ocean while still attached to the continent, are called ice shelves.

For an ice sheet to have constant size, the mass of ice added from snowfall must equal the mass lost due to melting and calving (when icebergs break off). Since this ice loss mainly occurs at the edges, the rate of ice loss will depend on how fast glaciers can flow towards the edges.

Ice shelves slow down this flow. They hold back the glaciers behind them in what is known as the “buttressing effect”. If the ice shelves were smaller, the glaciers would flow much faster towards the ocean, melting and calving more ice than snowfall inland could replace. This situation is called a “negative mass balance”, which leads directly to global sea level rise.

Photo by Tas van Ommen

Respect the ice shelves. They are holding back disaster.

Ice shelves are perhaps the most important part of the Antarctic ice sheet for its overall stability. Unfortunately, they are also the part of the ice sheet most at risk. This is because they are the only bits touching the ocean. And the Antarctic ice sheet is not directly threatened by a warming atmosphere – it is threatened by a warming ocean.

The atmosphere would have to warm outrageously in order to melt the Antarctic ice sheet from the top down. Snowfall tends to be heaviest when temperatures are just below 0°C, but temperatures at the South Pole rarely go above -20°C, even in the summer. So atmospheric warming will likely lead to a slight increase in snowfall over Antarctica, adding to the mass of the ice sheet. Unfortunately, the ocean is warming at the same time. And a slightly warmer ocean will be very good at melting Antarctica from the bottom up.

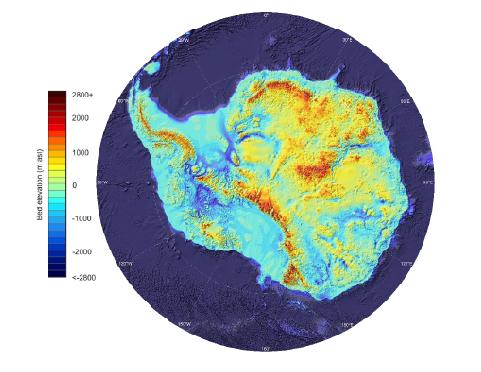
This is partly because ice melts faster in water than it does in air, even if the air and the water are the same temperature. But the ocean-induced melting will be exacerbated by some unlucky topography: over 40% of the Antarctic ice sheet (by area) rests on bedrock that is below sea level.

bedmap2

Elevation of the bedrock underlying Antarctica. All of the blue regions are below sea level. (Figure 9 of Fretwell et al.)

This means that ocean water can melt its way in and get right under the ice, and gravity won’t stop it. The grounding lines, where the ice sheet detaches from the bedrock and floats on the ocean as an ice shelf, will retreat. Essentially, a warming ocean will turn more of the Antarctic ice sheet into ice shelves, which the ocean will then melt from the bottom up.

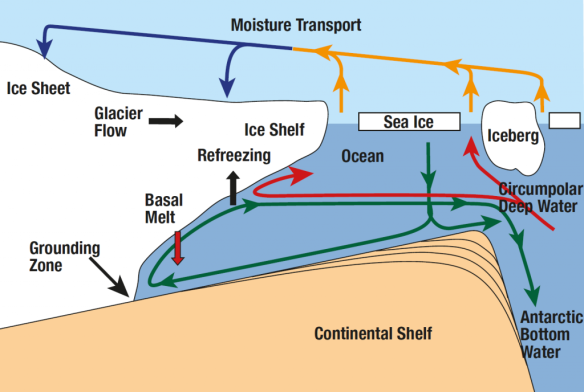
This situation is especially risky on a retrograde bed, where bedrock gets deeper below sea level as you go inland – like a giant, gently sloping bowl. Retrograde beds occur because of isostatic loading (the weight of an ice sheet pushes the crust down, making the tectonic plate sit lower in the mantle) as well as glacial erosion (the ice sheet scrapes away the surface bedrock over time). Ice sheets resting on retrograde beds are inherently unstable, because once the grounding lines reach the edge of the “bowl”, they will eventually retreat all the way to the bottom of the “bowl” even if the ocean water intruding beneath the ice doesn’t get any warmer. This instability occurs because the melting point temperature of water decreases as you go deeper in the ocean, where pressures are higher. In other words, the deeper the ice is in the ocean, the easier it is to melt it. Equivalently, the deeper a grounding line is in the ocean, the easier it is to make it retreat. In a retrograde bed, retreating grounding lines get deeper, so they retreat more easily, which makes them even deeper, and they retreat even more easily, and this goes on and on even if the ocean stops warming.

retrograde_bed

Diagram of an ice shelf on a retrograde bed (“Continental shelf”)

Which brings us to Terrifying Paper #1, by Rignot et al. A decent chunk of West Antarctica, called the Amundsen Sea Sector, is melting particularly quickly. The grounding lines of ice shelves in this region have been rapidly retreating (several kilometres per year), as this paper shows using satellite data. Unfortunately, the Amundsen Sea Sector sits on a retrograde bed, and the grounding lines have now gone past the edge of it. This retrograde bed is so huge that the amount of ice sheet it underpins would cause 1.2 metres of global sea level rise. We’re now committed to losing that ice eventually, even if the ocean stopped warming tomorrow. “Upstream of the 2011 grounding line positions,” Rignot et al., write, “we find no major bed obstacle that would prevent the glaciers from further retreat and draw down the entire basin.”

They look at each source glacier in turn, and it’s pretty bleak:

  • Pine Island Glacier: “A region where the bed elevation is smoothly decreasing inland, with no major hill to prevent further retreat.”
  • Smith/Kohler Glaciers: “Favorable to more vigorous ice shelf melt even if the ocean temperature does not change with time.”
  • Thwaites Glacier: “Everywhere along the grounding line, the retreat proceeds along clear pathways of retrograde bed.”

Only one small glacier, Haynes Glacier, is not necessarily doomed, since there are mountains in the way that cut off the retrograde bed.

From satellite data, you can already see the ice sheet speeding up its flow towards the coast, due to the loss of buttressing as the ice shelves thin: “Ice flow changes are detected hundreds of kilometers inland, to the flanks of the topographic divides, demonstrating that coastal perturbations are felt far inland and propagate rapidly.”

It will probably take a few centuries for the Amundsen Sector to fully disintegrate. But that 1.2 metres of global sea level rise is coming eventually, on top of what we’ve already seen from other glaciers and thermal expansion, and there’s nothing we can do to stop it (short of geoengineering). We’re going to lose a lot of coastal cities because of this glacier system alone.

Terrifying Paper #2, by Mengel & Levermann, examines the Wilkes Basin Sector of East Antarctica. This region contains enough ice to raise global sea level by 3 to 4 metres. Unlike the Amundsen Sector, we aren’t yet committed to losing this ice, but it wouldn’t be too hard to reach that point. The Wilkes Basin glaciers rest on a system of deep troughs in the bedrock. The troughs are currently full of ice, but if seawater got in there, it would melt all the way along the troughs without needing any further ocean warming – like a very bad retrograde bed situation. The entire Wilkes Basin would change from ice sheet to ice shelf, bringing along that 3-4 metres of global sea level rise.

It turns out that the only thing stopping seawater getting in the troughs is a very small bit of ice, equivalent to only 8 centimetres of global sea level rise, which Mengel & Levermann nickname the “ice plug”. As long as the ice plug is there, this sector of the ice sheet is stable; but take the ice plug away, and the whole thing will eventually fall apart even if the ocean stops warming. Simulations from an ice sheet model suggest it would take at least 200 years of increased ocean temperature to melt this ice plug, depending on how much warmer the ocean got. 200 years sounds like a long time for us to find a solution to climate change, but it actually takes much longer than that for the ocean to cool back down after it’s been warmed up.

This might sound like all bad news. And you’re right, it is. But it can always get worse. That means we can always stop it from getting worse. That’s not necessarily good news, but at least it’s empowering. The sea level rise we’re already committed to, whether it’s 1 or 2 or 5 metres, will be awful. But it’s much better than 58 metres, which is what we would get if the entire Antarctic ice sheet melted. Climate change is not an all-or-nothing situation; it falls on a spectrum. We will have to deal with some amount of climate change no matter what. The question of “how much” is for us to decide.

Explaining the Seasons on ‘Game of Thrones’

If you haven’t yet watched the television series Game of Thrones or read George R. R. Martin’s A Song of Ice and Fire books on which the show is based, I would urge you to get started (unless you are a small child, in which case I would urge you to wait a few years). The show and the books are both absolute masterpieces (although, as I alluded, definitely not for kids). I’m not usually a big fan of high fantasy, but the character and plot development of this series really pulled me in.

One of the most interesting parts of the series – maybe just for me – is the way the seasons work in Westeros and Essos, the continents explored in Game of Thrones. Winter and summer occur randomly, and can last anywhere from a couple of years to more than a decade. (Here a “year” is presumably defined by a complete rotation of the planet around the Sun, which can be discerned by the stars, rather than by one full cycle of the seasons.)

So what causes these random, multiyear seasons? Many people, George R. R. Martin included, brush off the causes as magical rather than scientific. To those people I say: you have no sense of fun.

After several lunchtime conversations with my friends from UNSW and U of T (few things are more fun than letting a group of climate scientists loose on a question like this), I think I’ve found a mechanism to explain the seasons. My hypothesis is simple, has been known to work on Earth, and satisfies all the criteria I can remember (I only read the books once and I didn’t take notes). I think that “winters” in Westeros are actually miniature ice ages, caused by the same orbital mechanisms which govern ice ages on Earth.

Glacial Cycles on Earth

First let’s look at how ice ages – the cold phases of glacial cycles – work on Earth. At their most basic level, glacial cycles are caused by gravity: the gravity of other planets in the solar system, which influence Earth’s orbit around the Sun. Three main orbital cycles, known as Milankovitch cycles, result:

  1. A 100,000 year cycle in eccentricity: how elliptical (as opposed to circular) Earth’s path around the Sun is.
  2. A 41,000 year cycle in obliquity: the degree of Earth’s axial tilt.
  3. A 26,000 year cycle in precession: what time of year the North Pole is pointing towards the Sun.

These three cycles combine to impact the timing and severity of the seasons in each hemisphere. The way they combine is not simple: the superposition of three sinusoidal functions with different periods is generally a mess, and often one cycle will cancel out the effects of another. However, sometimes the three cycles combine to make the Northern Hemisphere winter relatively warm, and the Northern Hemisphere summer relatively cool.

These conditions are ideal for glacier growth in the Northern Hemisphere. A warmer winter, as long as it’s still below freezing, will often actually cause more snow to fall. A cool summer will prevent that snow from entirely melting. And as soon as you’ve got snow that sticks around for the entire year, a glacier can begin to form.

Then the ice-albedo feedback kicks in. Snow and ice reflect more sunlight than bare ground, meaning less solar radiation is absorbed by the surface. This makes the Earth’s average temperature go down, so even less of the glacier will melt each summer. Now the glacier is larger and can reflect even more sunlight. This positive feedback loop, or “vicious cycle”, is incredibly powerful. Combined with carbon cycle feedbacks, it caused glaciers several kilometres thick to spread over most of North America and Eurasia during the last ice age.

The conditions are reversed in the Southern Hemisphere: relatively cold winters and hot summers, which cause glaciers to recede. However, at this stage in Earth’s history, most of the continents are concentrated in the Northern Hemisphere. The south is mostly ocean, where there are no glaciers to recede. For this reason, the Northern Hemisphere is the one which controls Earth’s glacial cycles.

These ice ages don’t last forever, because sooner or later the Milankovitch cycles will combine in the opposite way: the Northern Hemisphere will have cold winters and hot summers, and its glaciers will start to recede. The ice-albedo feedback will be reversed: less snow and ice means more sunlight is absorbed, which makes the planet warmer, which means there is less snow and ice, and so on.

Glacial Cycles in Westeros?

I propose that Westeros (or rather, the unnamed planet which contains Westeros and Essos and any other undiscovered continents in Game of Thrones; let’s call it Westeros-world) experiences glacial cycles just like Earth, but the periods of the underlying Milankovitch cycles are much shorter – on the order of years to decades. This might imply the presence of very large planets close by, or a high number of planets in the solar system, or even multiple other solar systems which are close enough to exert significant gravitational attraction. As far as I know, all of these ideas are plausible, but I encourage any astronomers in the audience to chime in.

Given the climates of various regions in Game of Thrones, it’s clear that they all exist in the Northern Hemisphere: the further north you go, the colder it gets. The southernmost boundary of the known world is probably somewhere around the equator, because it never starts getting cold again as you travel south. Beyond that, the planet is unexplored, and it’s plausible that the Southern Hemisphere is mainly ocean. The concentration of continents in one hemisphere would allow Milankovitch cycles to induce glacial cycles in Westeros-world.

The glacial periods (“winter”) and interglacials (“summer”) would vary in length – again, on the scale of years to decades – and would appear random: the superposition of three different sine functions has an erratic pattern of peaks and troughs when you zoom in. Of course, the pattern of season lengths would eventually repeat itself, with a period equal to the least common multiple of the three Milankovitch cycle periods. But this least common multiple could be so large – centuries or even millennia – that the seasons would appear random on a human timescale. It’s not hard to believe that the people of Westeros, even the highly educated maesters, would fail to recognize a pattern which took hundreds or thousands of years to repeat.

Of course, within each glacial cycle there would be multiple smaller seasons as the planet revolved around the Sun – the way that regular seasons work on Earth. However, if the axial tilt of Westeros-world was sufficiently small, these regular seasons could be overwhelmed by the glacial cycles to the point where nobody would notice them.

There could be other hypotheses involving fluctuations in solar intensity, frequent volcanoes shooting sulfate aerosols into the stratosphere, or rapid carbon cycle feedbacks. But I think this one is the most plausible, because it’s known to happen on Earth (albeit on a much longer timescale). Can you find any holes? Please go nuts in the comments.

Climate change and the jet stream

Here in the northern mid-latitudes (much of Canada and the US, Europe, and the northern half of Asia) our weather is governed by the jet stream. This high-altitude wind current, flowing rapidly from west to east, separates cold Arctic air (to the north) from warmer temperate air (to the south). So on a given day, if you’re north of the jet stream, the weather will probably be cold; if you’re to the south, it will probably be warm; and if the jet stream is passing over you, you’re likely to get rain or snow.

The jet stream isn’t straight, though; it’s rather wavy in the north-south direction, with peaks and troughs. So it’s entirely possible for Calgary to experience a cold spell (sitting in a trough of the jet stream) while Winnipeg, almost directly to the east, has a heat wave (sitting in a peak). The farther north and south these peaks and troughs extend, the more extreme these temperature anomalies tend to be.

Sometimes a large peak or trough will hang around for weeks on end, held in place by certain air pressure patterns. This phenomenon is known as “blocking”, and is often associated with extreme weather. For example, the 2010 heat wave in Russia coincided with a large, stationary, long-lived peak in the polar jet stream. Wildfires, heat stroke, and crop failure ensued. Not a pretty picture.

As climate change adds more energy to the atmosphere, it would be naive to expect all the wind currents to stay exactly the same. Predicting the changes is a complicated business, but a recent study by Jennifer Francis and Stephen Vavrus made headway on the polar jet stream. Using North American and North Atlantic atmospheric reanalyses (models forced with observations rather than a spin-up) from 1979-2010, they found that Arctic amplification – the faster rate at which the Arctic warms, compared to the rest of the world – makes the jet stream slower and wavier. As a result, blocking events become more likely.

Arctic amplification occurs because of the ice-albedo effect: there is more snow and ice available in the Arctic to melt and decrease the albedo of the region. (Faster-than-average warming is not seen in much of Antarctica, because a great deal of thermal inertia is provided to the continent in the form of strong circumpolar wind and ocean currents.) This amplification is particularly strong in autumn and winter.

Now, remembering that atmospheric pressure is directly related to temperature, and pressure decreases with height, warming a region will increase the height at which pressure falls to 500 hPa. (That is, it will raise the 500 hPa “ceiling”.) Below that, the 1000 hPa ceiling doesn’t rise very much, because surface pressure doesn’t usually go much above 1000 hPa anyway. So in total, the vertical portion of the atmosphere that falls between 1000 and 500 hPa becomes thicker as a result of warming.

Since the Arctic is warming faster than the midlatitudes to the south, the temperature difference between these two regions is smaller. Therefore, the difference in 1000-500 hPa thickness is also smaller. Running through a lot of complicated physics equations, this has two main effects:

  1. Winds in the east-west direction (including the jet stream) travel more slowly.
  2. Peaks of the jet stream are pulled farther north, making the current wavier.

Also, both of these effects reinforce each other: slow jet streams tend to be wavier, and wavy jet streams tend to travel more slowly. The correlation between relative 1000-500 hPa thickness and these two effects is not statistically significant in spring, but it is in the other three seasons. Also, melting sea ice and declining snow cover on land are well correlated to relative 1000-500 hPa thickness, which makes sense because these changes are the drivers of Arctic amplification.

Consequently, there is now data to back up the hypothesis that climate change is causing more extreme fall and winter weather in the mid-latitudes, and in both directions: unusual cold as well as unusual heat. Saying that global warming can cause regional cold spells is not a nefarious move by climate scientists in an attempt to make every possible outcome support their theory, as some paranoid pundits have claimed. Rather, it is another step in our understanding of a complex, non-linear system with high regional variability.

Many recent events, such as record snowfalls in the US during the winters of 2009-10 and 2010-11, are consistent with this mechanism – it’s easy to see that they were caused by blocking in the jet stream when Arctic amplification was particularly high. They may or may not have happened anyway, if climate change wasn’t in the picture. However, if this hypothesis endures, we can expect more extreme weather from all sides – hotter, colder, wetter, drier – as climate change continues. Don’t throw away your snow shovels just yet.

The PETM

Lately I have been reading a lot about the Paleocene-Eocene Thermal Maximum, or PETM, which is my favourite paleoclimatic event (is it weird to have a favourite?) This episode of rapid global warming 55 million years ago is particularly relevant to our situation today, because it was clearly caused by greenhouse gases. Unfortunately, the rest of the story is far less clear.

Paleocene mammals

The PETM happened about 10 million years after the extinction that killed the dinosaurs. The Age of Mammals was well underway, although humans wouldn’t appear in any form for another few million years. It was several degrees warmer, to start with, than today’s conditions. Sea levels would have been higher, and there were probably no polar ice caps.

Then, over several thousand years, the world warmed by between 5 and 8°C. It seems to have happened in a few bursts, against a background of slower temperature increase. Even the deep ocean, usually a very stable thermal environment, warmed by at least 5°C. It took around a hundred thousand years for the climate system to recover.

Such rapid global warming hasn’t been seen since, although it’s possible (probable?) that human-caused warming will surpass this rate, if it hasn’t already. It is particularly troubling to realize that our species has never before experienced an event like the one we’re causing today. The climate has changed before, but humans generally weren’t there to see it.

The PETM is marked in the geological record by a sudden jump in the amount of “light” carbon in the climate system. Carbon comes in different isotopes, two of which are most important for climate analysis: carbon with 7 neutrons (13C), and carbon with 6 neutrons (12C). Different carbon cycle processes sequester these forms of carbon in different amounts. Biological processes like photosynthesis preferentially take 12C out of the air in the form of CO2, while geological processes like subduction of the Earth’s crust take anything that’s part of the rock. When the carbon comes back up, the ratios of 12C to 13C are preserved: emissions from the burning of fossil fuels, for example, are relatively “light” because they originated from the tissues of living organisms; emissions from volcanoes are more or less “normal” because they came from molten crust that was once the ocean floor.

In order to explain the isotopic signature of the PETM, you need to add to the climate system either a massive amount of carbon that’s somewhat enriched in light carbon, or a smaller amount of carbon that’s extremely enriched in light carbon, or (most likely) something in the middle. The carbon came in the form of CO2, or possibly CH4 that soon oxidized to form CO2. That, in turn, almost certainly caused the warming.

There was a lot of warming, though, so there must have been a great deal of carbon. We don’t know exactly how much, because the warming power of CO2 depends on how much is already present in the atmosphere, and estimates for initial CO2 concentration during the PETM vary wildly. However, the carbon injection was probably something like 5 trillion tonnes. This is comparable to the amount of carbon we could emit today from burning all our fossil fuel reserves. That’s a heck of a lot of carbon, and what nobody can figure out is where did it all come from?

Arguably the most popular hypothesis is methane hydrates. On continental shelves, methane gas (CH4) is frozen into the ocean floor. Microscopic cages of water contain a single molecule of methane each, but when the water melts the methane is released and bubbles up to the surface. Today there are about 10 trillion tonnes of carbon stored in methane hydrates. In the PETM the levels were lower, but nobody is sure by how much.

The characteristics of methane hydrates seem appealing as an explanation for the PETM. They are very enriched in 12C, meaning less of them would be needed to cause the isotopic shift. They discharge rapidly and build back up slowly, mirroring the sudden onset and slow recovery of the PETM. The main problem with the methane hydrate hypothesis is that there might not have been enough of them to account for the warming observed in the fossil record.

However, remember that in order to release their carbon, methane hydrates must first warm up enough to melt. So some other agent could have started the warming, which then triggered the methane release and the sudden bursts of warming. There is no geological evidence for any particular source – everything is speculative, except for the fact that something spat out all this CO2.

Magnified foraminifera

Don’t forget that where there is greenhouse warming, there is ocean acidification. The ocean is great at soaking up greenhouse gases, but this comes at a cost to organisms that build shells out of calcium carbonate (CaCO3, the same chemical that makes up chalk). CO2 in the water forms carbonic acid, which starts to dissolve their shells. Likely for this reason, the PETM caused a mass extinction of benthic foraminifera (foraminifera = microscopic animals with CaCO3 shells; benthic = lives on the ocean floor).

Other groups of animals seemed to do okay, though. There was a lot of rearranging of habitats – species would disappear in one area but flourish somewhere else – but no mass extinction like the one that killed the dinosaurs. The fossil record can be deceptive in this manner, though, because it only preserves a small number of species. By sheer probability, the most abundant and widespread organisms are most likely to appear in the fossil record. There could be many organisms that were less common, or lived in restricted areas, that went extinct without leaving any signs that they ever existed.

Climate modellers really like the PETM, because it’s a historical example of exactly the kind of situation we’re trying to understand using computers. If you add a few trillion tonnes of carbon to the atmosphere in a relatively short period of time, how much does the world warm and what happens to its inhabitants? The PETM ran this experiment for us in the real world, and can give us some idea of what to expect in the centuries to come. If only it had left more data behind for us to discover.

References:
Pagani et al., 2006
Dickens, 2011
McInerney and Wing, 2011

Permafrost Projections

During my summer at UVic, two PhD students at the lab (Andrew MacDougall and Chris Avis) as well as my supervisor (Andrew Weaver) wrote a paper modelling the permafrost carbon feedback, which was recently published in Nature Geoscience. I read a draft version of this paper several months ago, and am very excited to finally share it here.

Studying the permafrost carbon feedback is at once exciting (because it has been left out of climate models for so long) and terrifying (because it has the potential to be a real game-changer). There is about twice as much carbon frozen into permafrost than there is floating around in the entire atmosphere. As high CO2 levels cause the world to warm, some of the permafrost will thaw and release this carbon as more CO2 – causing more warming, and so on. Previous climate model simulations involving permafrost have measured the CO2 released during thaw, but haven’t actually applied it to the atmosphere and allowed it to change the climate. This UVic study is the first to close that feedback loop (in climate model speak we call this “fully coupled”).

The permafrost part of the land component was already in place – it was developed for Chris’s PhD thesis, and implemented in a previous paper. It involves converting the existing single-layer soil model to a multi-layer model where some layers can be frozen year-round. Also, instead of the four RCP scenarios, the authors used DEPs (Diagnosed Emission Pathways): exactly the same as RCPs, except that CO2 emissions, rather than concentrations, are given to the model as input. This was necessary so that extra emissions from permafrost thaw would be taken into account by concentration values calculated at the time.

As a result, permafrost added an extra 44, 104, 185, and 279 ppm of CO2 to the atmosphere for DEP 2.6, 4.5, 6.0, and 8.5 respectively. However, the extra warming by 2100 was about the same for each DEP, with central estimates around 0.25 °C. Interestingly, the logarithmic effect of CO2 on climate (adding 10 ppm to the atmosphere causes more warming when the background concentration is 300 ppm than when it is 400 ppm) managed to cancel out the increasing amounts of permafrost thaw. By 2300, the central estimates of extra warming were more variable, and ranged from 0.13 to 1.69 °C when full uncertainty ranges were taken into account. Altering climate sensitivity (by means of an artificial feedback), in particular, had a large effect.

As a result of the thawing permafrost, the land switched from a carbon sink (net CO2 absorber) to a carbon source (net CO2 emitter) decades earlier than it would have otherwise – before 2100 for every DEP. The ocean kept absorbing carbon, but in some scenarios the carbon source of the land outweighed the carbon sink of the ocean. That is, even without human emissions, the land was emitting more CO2 than the ocean could soak up. Concentrations kept climbing indefinitely, even if human emissions suddenly dropped to zero. This is the part of the paper that made me want to hide under my desk.

This scenario wasn’t too hard to reach, either – if climate sensitivity was greater than 3°C warming per doubling of CO2 (about a 50% chance, as 3°C is the median estimate by scientists today), and people followed DEP 8.5 to at least 2013 before stopping all emissions (a very intense scenario, but I wouldn’t underestimate our ability to dig up fossil fuels and burn them really fast), permafrost thaw ensured that CO2 concentrations kept rising on their own in a self-sustaining loop. The scenarios didn’t run past 2300, but I’m sure that if you left it long enough the ocean would eventually win and CO2 would start to fall. The ocean always wins in the end, but things can be pretty nasty until then.

As if that weren’t enough, the paper goes on to list a whole bunch of reasons why their values are likely underestimates. For example, they assumed that all emissions from permafrost were  CO2, rather than the much stronger CH4 which is easily produced in oxygen-depleted soil; the UVic model is also known to underestimate Arctic amplification of climate change (how much faster the Arctic warms than the rest of the planet). Most of the uncertainties – and there are many – are in the direction we don’t want, suggesting that the problem will be worse than what we see in the model.

This paper went in my mental “oh shit” folder, because it made me realize that we are starting to lose control over the climate system. No matter what path we follow – even if we manage slightly negative emissions, i.e. artificially removing CO2 from the atmosphere – this model suggests we’ve got an extra 0.25°C in the pipeline due to permafrost. It doesn’t sound like much, but add that to the 0.8°C we’ve already seen, and take technological inertia into account (it’s simply not feasible to stop all emissions overnight), and we’re coming perilously close to the big nonlinearity (i.e. tipping point) that many argue is between 1.5 and 2°C. Take political inertia into account (most governments are nowhere near even creating a plan to reduce emissions), and we’ve long passed it.

Just because we’re probably going to miss the the first tipping point, though, doesn’t mean we should throw up our hands and give up. 2°C is bad, but 5°C is awful, and 10°C is unthinkable. The situation can always get worse if we let it, and how irresponsible would it be if we did?

More on Phytoplankton

On the heels of my last post about iron fertilization of the ocean, I found another interesting paper on the topic. This one, written by Long Cao and Ken Caldeira in 2010, was much less hopeful.

Instead of a small-scale field test, Cao and Caldeira decided to model iron fertilization using the ocean GCM from Lawrence Livermore National Laboratory. To account for uncertainties, they chose to calculate an upper bound on iron fertilization rather than a most likely scenario. That is, they maxed out phytoplankton growth until something else became the limiting factor – in this case, phosphates. On every single cell of the sea surface, the model phytoplankton were programmed to grow until phosphate concentrations were zero.

A 2008-2100 simulation implementing this method was forced with CO2 emissions data from the A2 scenario. An otherwise identical A2 simulation did not include the ocean fertilization, to act as a control. Geoengineering modelling is strange that way, because there are multiple definitions of “control run”: a non-geoengineered climate that is allowed to warm unabated, as well as preindustrial conditions (the usual definition in climate modelling).

Without any geoengineering, atmospheric CO2 reached 965 ppm by 2100. With the maximum amount of iron fertilization possible, these levels only fell to 833 ppm. The mitigation of ocean acidification was also quite modest: the sea surface pH in 2100 was 7.74 without geoengineering, and 7.80 with. Given the potential side effects of iron fertilization, is such a small improvement worth the trouble?

Unfortunately, the ocean acidification doesn’t end there. Although the problem was lessened somewhat at the surface, deeper layers in the ocean actually became more acidic. There was less CO2 being gradually mixed in from the atmosphere, but another source of dissolved carbon appeared: as the phytoplankton died and sank, they decomposed a little bit and released enough CO2 to cause a net decrease in pH compared to the control run.

In the diagram below, compare the first row (A2 control run) to the second (A2 with iron fertilization). The more red the contours are, the more acidic that layer of the ocean is with respect to preindustrial conditions. The third row contains data from another simulation in which emissions were allowed to increase just enough to offest sequestration by phytoplankton, leading to the same CO2 concentrations as the control run. The general pattern – iron fertilization reduces some acidity at the surface, but increases it at depth – is clear.

depth vs. latitude at 2100 (left); depth vs. time (right)

The more I read about geoengineering, the more I realize how poor the associated cost-benefit ratios might be. The oft-repeated assertion is true: the easiest way to prevent further climate change is, by a long shot, to simply reduce our emissions.

Feeding the Phytoplankton

While many forms of geoengineering involve counteracting global warming with induced cooling, others move closer to the source of the problem and target the CO2 increase. By artificially boosting the strength of natural carbon sinks, it might be possible to suck CO2 emissions right out of the air. Currently around 30% of human emissions are absorbed by these sinks; if we could make this metric greater than 100%, atmospheric CO2 concentrations would decline.

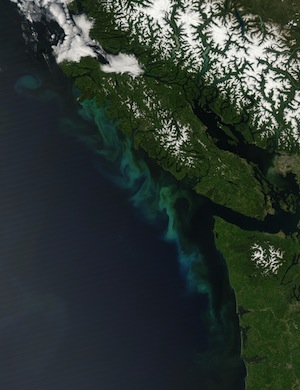
One of the most prominent proposals for carbon sink enhancement involves enlisting phytoplankton, photosynthetic organisms in the ocean which take the carbon out of carbon dioxide and use it to build their bodies. When nutrients are abundant, phytoplankton populations explode and create massive blue or green blooms visible from space. Very few animals enjoy eating these organisms, so they just float there for a while. Then they run out of nutrients, die, and sink to the bottom of the ocean, taking the carbon with them.

Phytoplankton blooms are a massive carbon sink, but they still can’t keep up with human emissions. This is because CO2 is not the limiting factor for their growth. In many parts of the ocean, the limiting factor is actually iron. So this geoengineering proposal, often known as “iron fertilization”, involves dumping iron compounds into the ocean and letting the phytoplankton go to work.

A recent study from Germany (see also the Nature news article) tested out this proposal on a small scale. The Southern Ocean, which surrounds Antarctica, was the location of their field tests, since it has a strong circumpolar current that kept the iron contained. After adding several tonnes of iron sulphate, the research ship tracked the phytoplankton as they bloomed, died, and sank.

Measurements showed that at least half of the phytoplankton sank below 1 km after they died, and “a substantial portion is likely to have reached the sea floor”. At this depth, which is below the mixed layer of the ocean, the water won’t be exposed to the atmosphere for centuries. The carbon from the phytoplankton’s bodies is safely stored away, without the danger of CO2 leakage that carbon capture and storage presents. Unlike in previous studies, the researchers were able to show that iron fertilization could be effective.

However, there are other potential side effects of large-scale iron fertilization. We don’t know what the impacts of so much iron might be on other marine life. Coating the sea surface with phytoplankton would block light from entering the mixed layer, decreasing photosynthesis in aquatic plants and possibly leading to oxygen depletion or “dead zones”. It’s also possible that toxic species of algae would get a hold of the nutrients and create poisonous blooms. On the other hand, the negative impacts of ocean acidification from high levels of CO2 would be lessened, a problem which is not addressed by solar radiation-based forms of geoengineering.

Evidently, the safest way to fix the global warming problem is to stop burning fossil fuels. Most scientists agree that geoengineering should be a last resort, an emergency measure to pull out if the Greenland ice sheet is about to go, rather than an excuse for nations to continue burning coal. And some scientists, myself included, fully expect that geoengineering will be necessary one day, so we might as well figure out the safest approach.

A Summer of Extremes

Because of our emissions of greenhouse gases like carbon dioxide, a little extra energy gets trapped in our atmosphere every day. Over time, this energy builds up. It manifests itself in the form of higher temperatures, stronger storms, larger droughts, and melting ice. Global warming, then, isn’t about temperatures as much as it is about energy.

The extra energy, and its consequences, don’t get distributed evenly around the world. Weather systems, which move heat and moisture around the planet, aren’t very fair: they tend to bully some places more than others. These days, it’s almost as if the weather picks geographical targets each season to bombard with extremes, then moves on to somewhere else. This season, the main target seems to be North America.

The warmest 12 months on record for the United States recently wrapped up with a continent-wide heat wave and drought. Thousands of temperature records were broken, placing millions of citizens in danger. By the end of June, 56% of the country was experiencing at least “moderate” drought levels – the largest drought since 1956. Wildfires took over Colorado, and extreme wind storms on the East Coast knocked out power lines and communication systems for a week. Conditions have been similar throughout much of Canada, although its climate and weather reporting systems are less accessible.

“This is what global warming looks like,”, said Professor Jonathan Overpeck from the University of Arizona, a sentiment that was echoed across the scientific community in the following weeks. By the end of the century, these conditions will be the new normal.

Does that mean that these particular events were caused by climate change? There’s no way of knowing. It could have just been a coincidence, but the extra energy global warming adds to our planet certainly made them more likely. Even without climate change, temperature records get broken all the time.

However, in an unchanging climate, there would be roughly the same amount of record highs as record lows. In a country like the United States, where temperature records are well catalogued and publicly available, it’s easy to see that this isn’t the case. From 2000-2009, there were twice as many record highs as record lows, and so far this year, there have been ten times as many:

The signal of climate change on extreme weather is slowly, but surely, emerging. For those who found this summer uncomfortable, the message from the skies is clear: Get used to it. This is only the beginning.

Modelling Geoengineering

Later in my career as a climate modeller, I expect to spend a lot of time studying geoengineering. Given the near-total absence of policy responses to prevent climate change, I think it’s very likely that governments will soon start thinking seriously about ways to artificially cool the planet. Who will they come to for advice? The climate modellers.

Some scientists are pre-emptively recognizing this need for knowledge, and beginning to run simulations of geoengineering. In fact, there’s an entire model intercomparison project dedicated to this area of study. There’s only a small handful of publications so far, but the results are incredibly interesting. Here I summarize two recent papers that model solar radiation management: the practice of offsetting global warming by partially blocking sunlight, whether by seeding clouds, adding sulfate aerosols to the stratosphere, or placing giant mirrors in space. As an added bonus, both of these papers are open access.

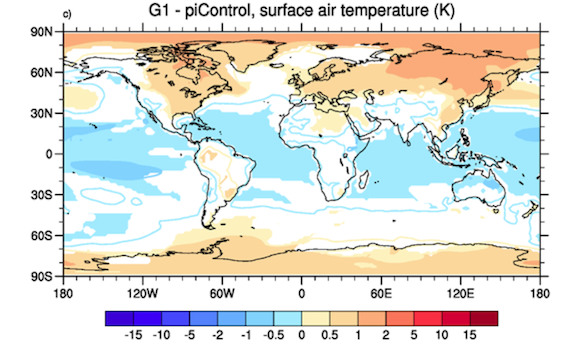
A group of scientists from Europe ran the same experiment on four of the world’s most complex climate models. The simulation involved instantaneously quadrupling CO2 from preindustrial levels, but offsetting it with a reduction in the solar constant, such that the net forcing was close to zero.

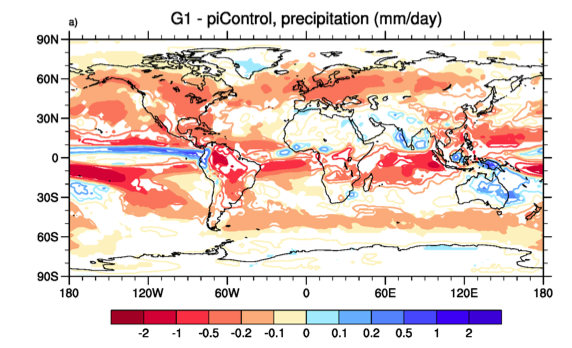
The global mean temperature remained at preindustrial levels. “Great,” you might think, “we’re home free!” However, climate is far more than just one globally averaged metric. Even though the average temperature stayed the same, there were still regional changes, with cooling in the tropics and warming at both poles (particularly in their respective winters):

There were regional changes in precipitation, too, but they didn’t all cancel out like with temperature. Global mean precipitation decreased, due to cloud feedbacks which are influenced by sunlight but not greenhouse gases. There were significant changes in the monsoons of south Asia, but the models disagreed as to exactly what those changes would be.

This intercomparison showed that even with geoengineering, we’re still going to get a different climate. We won’t have to worry about some of the big-ticket items like sea level rise, but droughts and forest dieback will remain a major threat. Countries will still struggle to feed their people, and species will still face extinction.

On the other side of the Atlantic, Damon Matthews and Ken Caldeira took a different approach. (By the way, what is it about Damon Matthews? All the awesome papers out of Canada seem to have his name on them.) Using the UVic ESCM, they performed a more realistic experiment in which emissions varied with time. They offset emissions from the A2 scenario with a gradually decreasing solar constant. They found that the climate responds quickly to geoengineering, and their temperature and precipitation results were very similar to the European paper.

They also examined some interesting feedbacks in the carbon cycle. Carbon sinks (ecosystems which absorb CO2, like oceans and forests) respond to climate change in two different ways. First, they respond directly to increases in atmospheric CO2 – i.e., the fertilization effect. These feedbacks (lumped together in a term we call beta) are negative, because they tend to increase carbon uptake. Second, they respond to the CO2-induced warming, with processes like forest dieback and increased respiration. These feedbacks (a term called gamma) are positive, because they decrease uptake. Currently we have both beta and gamma, and they’re partially cancelling each other out. However, with geoengineering, the heat-induced gamma goes away, and beta is entirely unmasked. As a result, carbon sinks became more effective in this experiment, and sucked extra CO2 out of the atmosphere.

The really interesting part of the Matthews and Caldeira paper was when they stopped the geoengineering. This scenario is rather plausible – wars, recessions, or public disapproval could force the world to abandon the project. So, in the experiment, they brought the solar constant back to current levels overnight.

The results were pretty ugly. Global climate rapidly shifted back to the conditions it would have experienced without geoengineering. In other words, all the warming that we cancelled out came back at once. Global average temperature changed at a rate of up to 4°C per decade, or 20 times faster than at present. Given that biological, physical, and social systems worldwide are struggling to keep up with today’s warming, this rate of change would be devastating. To make things worse, gamma came back in full force, and carbon sinks spit out the extra CO2 they had soaked up. Atmospheric concentrations went up further, leading to more warming.

Essentially, if governments want to do geoengineering properly, they have to make a pact to do so forever, no matter what the side effects are or what else happens in the world. Given how much legislation is overturned every time a country has a change in government, such a promise would be almost impossible to uphold. Matthews and Caldeira consider this reality, and come to a sobering conclusion:

In the case of inconsistent or erratic deployment (either because of shifting public opinions or unilateral action by individual nations), there would be the potential for large and rapid temperature oscillations between cold and warm climate states.

Yikes. If that doesn’t scare you, what does?